- Currently achieved results of neutron flux measurement in the Lazy Susan facility of TRIGA reactor at ENEA Casaccia.
- Spectrum unfolding performed with 10 degrees of freedom (energy groups) using the experimental data of about 40 activation reactions.
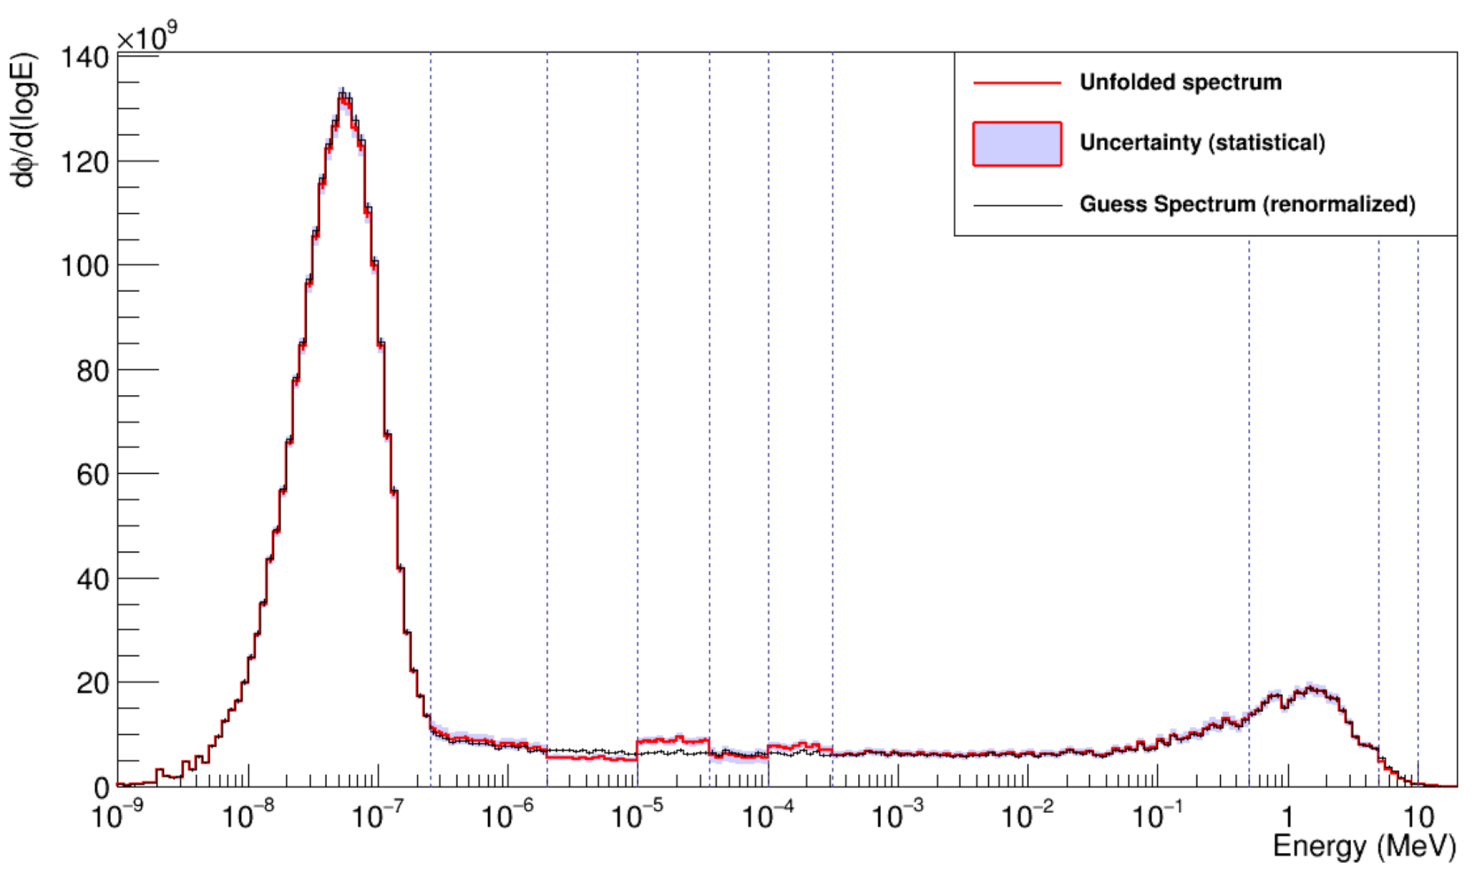 Figure 1 - Unfolded neutron flux spectrum in the Lazy Susan (channel #1) facility at 100 kW power. The flux spectrum is represented using the lethargic scale, with flux in units of n/(cm2 s). The red line is obtained by normalizing the guess spectrum groups to the multi-group flux intensities reported in Table 4 of [Chiesa et al. (2019)]. The subdivision of energy ranges is shown by the dotted vertical lines. The light blue shaded area corresponds to the uncertainty of the flux in each group. The black line is the guess spectrum used for the unfolding normalized to the total flux intensity
This work was supported by ASI-ENEA ASIF implementation agreement no. 2017-22-H.0 and ASI-INFN ASIF implementation agreement no. 2017-15-H.0.
Bibliography
[Chiesa et al. (2019)] D. Chiesa, M. Carta, V. Fabrizio, L. Falconi, A. Grossi, M. Nastasi, M. Palomba, S. Pozzi, E. Previtali, P. G. Rancoita, B. Ranghetti, M. Tacconi, Characterization of TRIGA RC-1 neutron irradiation facilities for radiation damage testing (2019), available at https://arxiv.org/abs/1911.09374